PROJECTS
"These projects have significantly contributed to my journey as a Data Analyst, demonstrating proficiency in problem definition, data collection, cleaning, analysis, and visualization."
Passionate data analyst proficient in SQL, Microsoft Power BI and excel, ready to leverage expertise for impactful insights.
@Linkedin
"These projects have significantly contributed to my journey as a Data Analyst, demonstrating proficiency in problem definition, data collection, cleaning, analysis, and visualization."
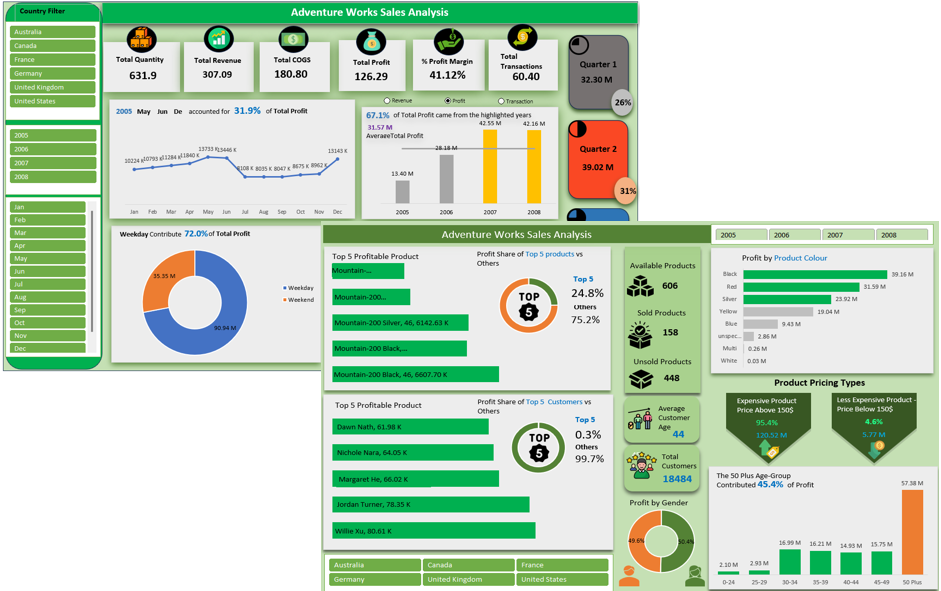
Four years of transactional data analyzed using excel to drive profitability insights for Adventure Works sales. Focused on product, customer location, and time trend analysis to detect patterns. Cleansed a six-table dataset in Excel, then created a comprehensive dashboard using pivot tables and extensively utilized Power Query and Power Pivot for data transformation.
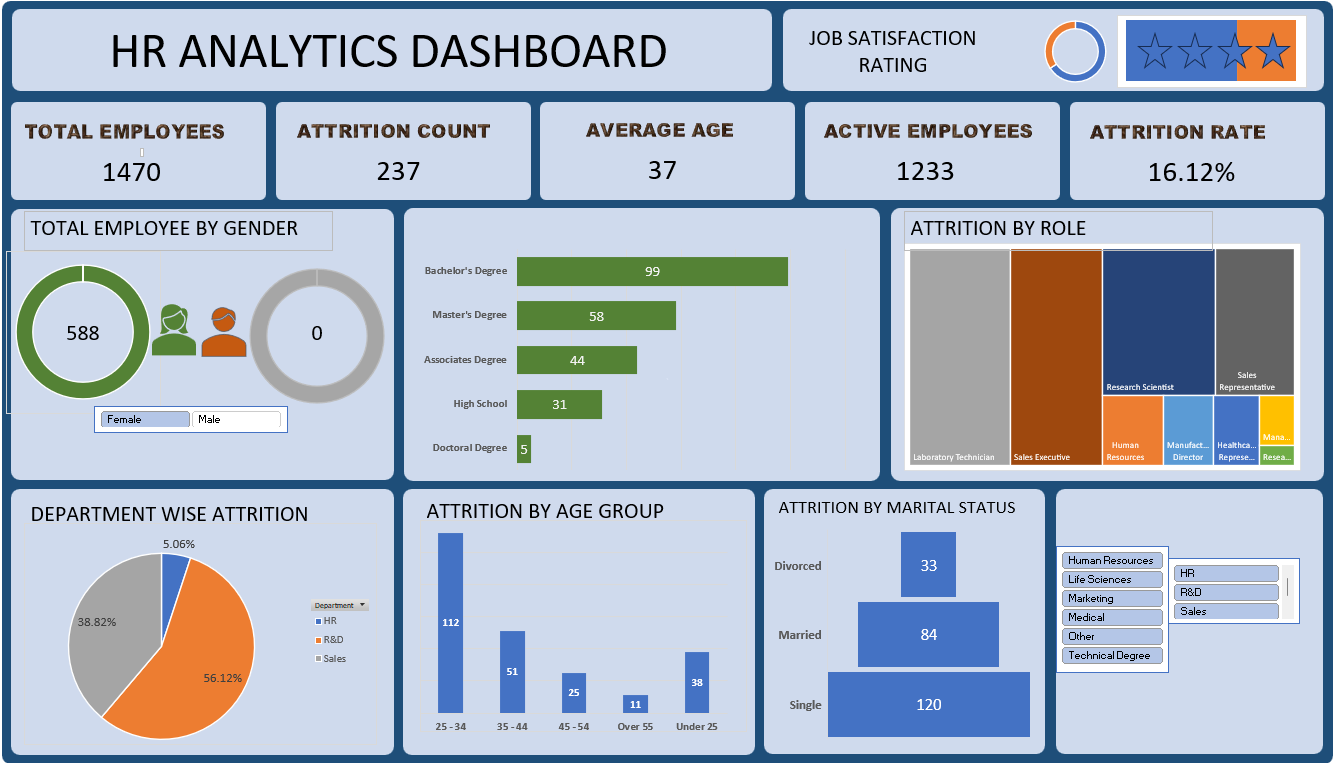
The HR dashboard primarily focuses on attrition data, facilitating streamlined presentation and effective monitoring of key workforce metrics related to employee turnover. Moreover, this dashboard enhances hiring processes by providing insights for informed talent decisions and strengthening onboarding procedures to boost retention rates and productivity.

This Data Analytics project focuses on Consumer Goods AdHoc Insights, aiming to provide thorough analyses covering market presence, product trends, cost optimization, customer discount assessment, and monthly sales performance evaluation to support strategic decision-making.
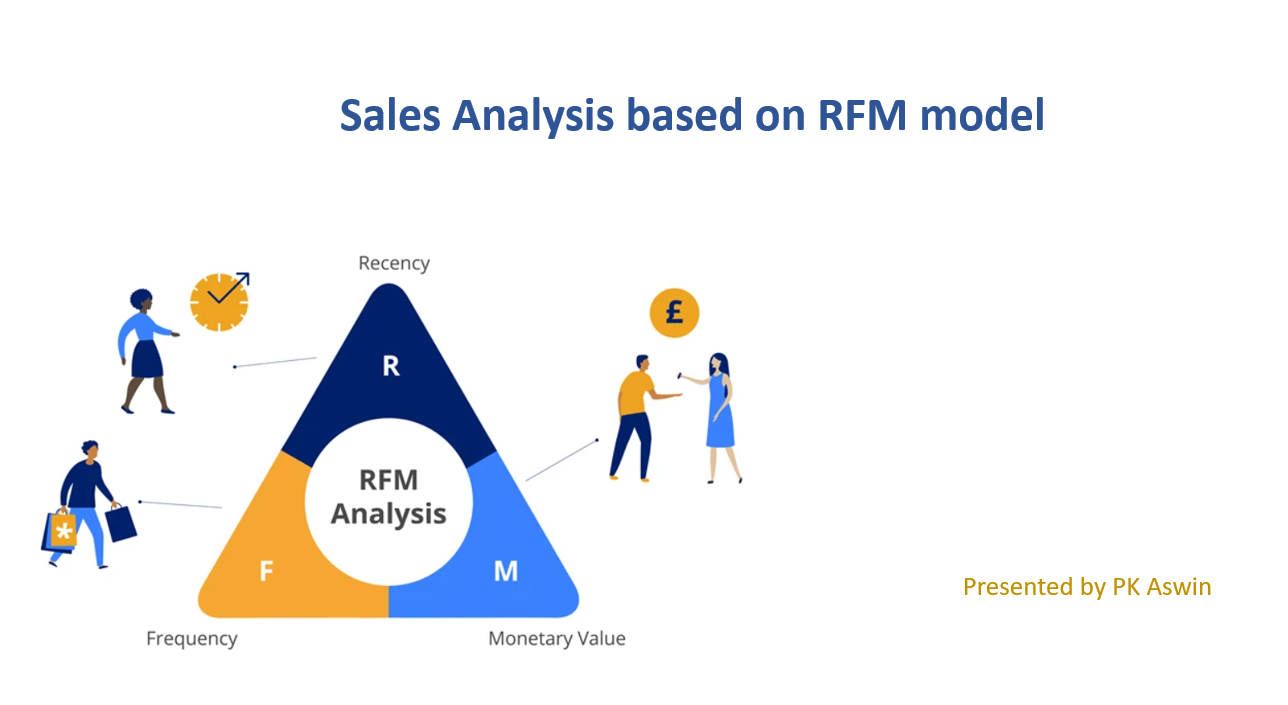
Leveraged the RFM model to analyze sales data, optimize marketing strategies, identify growth opportunities, and rank customer segments by proportion, focusing on enhancing new customer acquisitions. Generated actionable insights on customer behavior, regional and temporal sales dynamics, and emerging trends to drive strategic decisions.
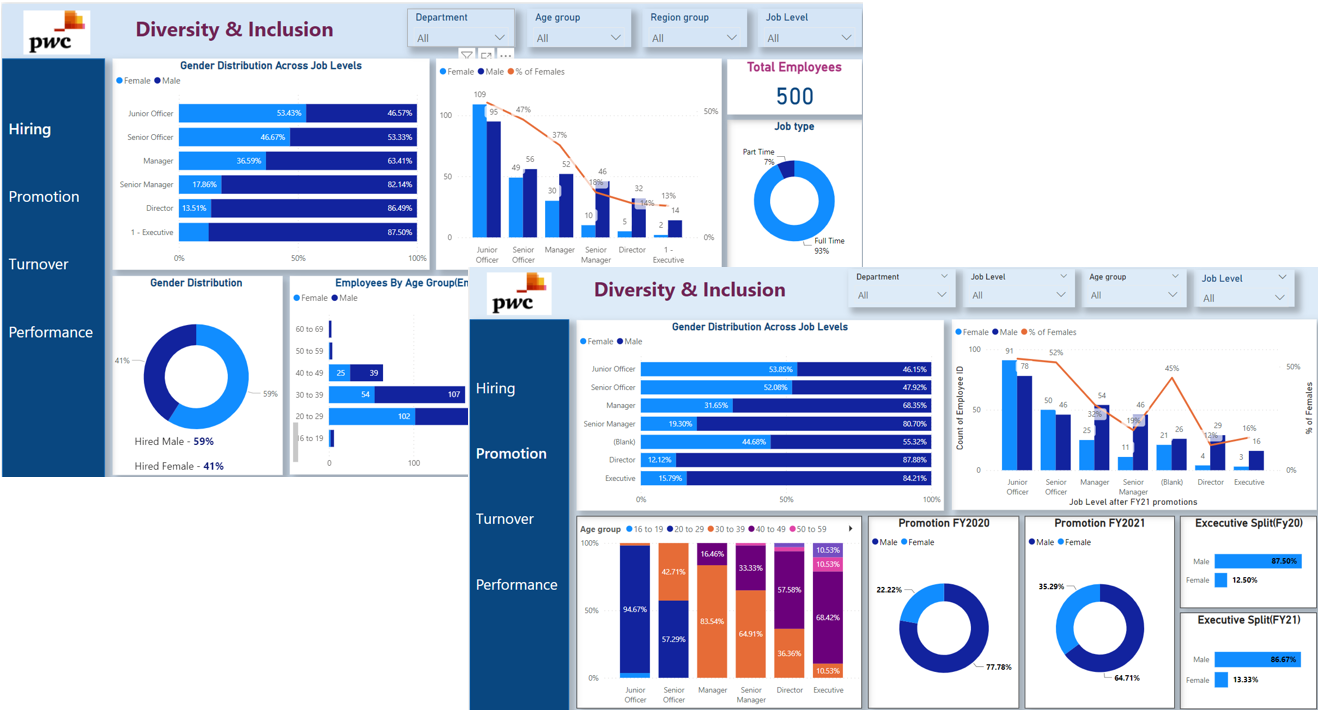
This dashboard was developed during my final assignment in PwC's virtual case experience program. Its purpose is to assist the HR team in evaluating the organization's progress in terms of diversity and inclusion. It displays key performance indicators (KPIs) related to hiring, promotion, performance, and turnover.
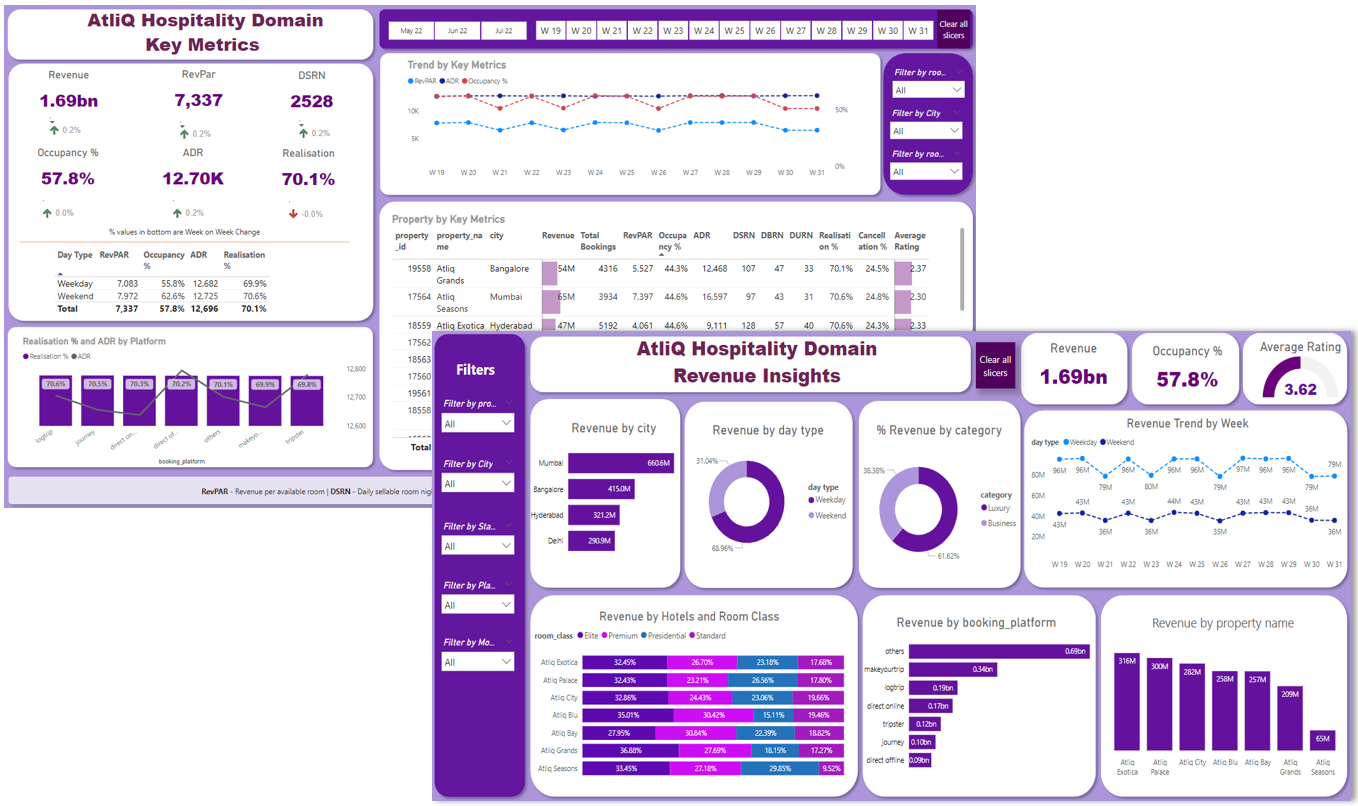
By developing a comprehensive Power BI dashboard and the meticulous refinement of data with Excel, Atliq Grand revitalized its market position. This initiative empowered the revenue team to anticipate a potential uptick in both revenue and market share through insightful analysis. Key metrics like RevPar, Occupancy, DSRN, ADR, URN, and BRN were thoroughly examined, along with detailed channel-level breakdowns.

Utilizing Pandas, NumPy, Matplotlib, and Seaborn, this Python project conducts an in-depth sales analysis for a bicycle shop. The project entails data cleaning, insightful visualizations, and segmentation analysis to enhance understanding and decision-making.

Performed data cleaning and manipulation using Pandas and NumPy, followed by exploratory data analysis (EDA) with Pandas, NumPy, Matplotlib, and Seaborn. Identified potential customers based on demographic factors and optimized sales strategies by analyzing top-selling product categories and individual products.